If you hang around your local gas station or food mart long enough, a scruffy-looking man will toddle in the door and request $25.00 of gas on pump nine, a pack of Camels Lights, one mega-million card and three of your dollar scratchers. He will then proceed to scratch the tickets as his gas pumps, only to return with a $2.00 winner that he would like to exchange for two more tickets. He will proceed to scratch the tickets again, discard them in the trash, and leave. You will not see this man again until next payday.
Gambling is a moron’s retirement plan, and it is certainly not our positive obligations to help morons. Yet, unlike the casinos, what is it about state lotteries that make these acts so contemptible?
By means of mandatory K-12 drill-and-kill public education, the state ill-educates the public into a pool of mathematical ignorance. Most high school students graduate without a single course in probability/statistics. Sure, in seventh grade they learn about the probability of pulling an ace out of a deck of cards, but permutations and combinations like that needed to calculate the odds of winning the mega-millionaire jackpot is only taught to the top percentile of high school students, which is usually recommended as an elective, not as a course of learning.
How convenient.
The state not only promotes the public’s ignorance in probabilities but then maximizes that ignorance via a monopoly on gambling.
Thus, simple equations like the one below are foreign to the majority of the populace.
Not only is the math foreign, but even the term “your odds of winning” is foreign to most individuals. What does 1 out of 80 million even denote to the average citizen?
Let us translate this into something more tangible that common individuals can comprehend.
Here is a penny
If this penny represents the chance of you winning the mega-lottery jackpot, then here is how many pennies you must choose from.
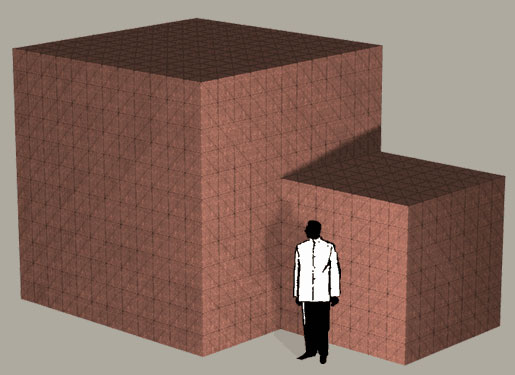
(See The Mega Penny Project)
Yet, you will find nothing of this nature on the lottery websites or the back of the cards. Instead you will find this:
LOTTERY
TYPE
Odds 1 Chance in:
US PowerBall
5/45 + 1/42
80,089,128
US The Big Game
5/50 + 1/36
76,275,360
(According to The Lottery Site)
Again, I am not highlighting that casinos and other private gambling venues should highlight such depictions of probability, but at least these private institutions are upfront about their self-indulgence. The state, however, promotes such ignorance from their constituents under the veil of moral good. States will even advertise the various “good things” it does with its lotto earnings (like promoting more public education or other state funding), while all along it’s the impoverished saps that keep giving away their money.
But whose money are they giving away?
What percentage of transfer payments like welfare, unemployment, disability or social security simply returns to the state via the “stupid tax”? More bluntly, what percentages of OUR paychecks are being given away?
Now, maybe the naysayer will argue that state gambling is indeed evil, but deregulated gambling would lead to even higher improbabilities of losing, and thus why we should outlaw gambling all together?
I don’t believe this to be true.
Sidestepping the issue that no one has the moral authority to assert what others may or may not do with their own money, competition in gambling would actually lead to higher probabilities of winning or some other form of payout. For example, casinos litter their hotels with free festivities and offerings so that consumers feel as though they are getting something for their money. Consumers may travel to Vegas, blow one month’s pay, and still have a great time. Casinos offer these extras not out of the good of their hearts, but because of the competition with other casinos.
When is the last time the state lottery offered such extras? Sure, you may write the losses off your income taxes (as if they actually own the income they tax) but that’s it! At least I can be sure that under a private lottery I would get some free gas, coffee, Reese Cups or some other kickback from the convenience store from which I bought the lottery ticket. If not, I will buy his competitors ticket.
Therefore, let us return one more time to the convenience of our malevolent state-controlled lottery. The state may choose what math is important for study, exploit that ignorance in mathematics, and veil its racketeering under the label of social good all from the comforts of its monopoly.
March 30, 2010
From Lewrockwell.com, here.